
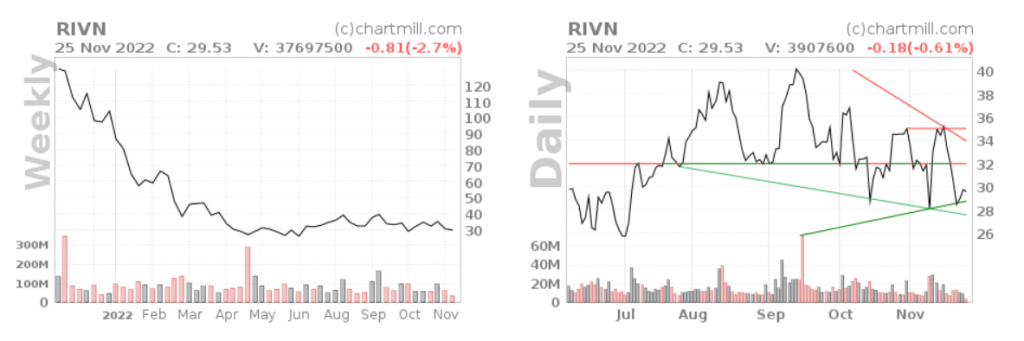
On November 25, Rivian Automotive, Inc (NASDAQ: RIVN) had a closing price of $29.53. When analyzing the support, there are two key areas. First, there was support at 28.72 from the trend line in the daily time frame. Lastly, there was support at 28.07.
As with the resistance, there is a zone between 31.68 and 31.98. The said zone is formed due to the combination of different trend lines and critical moving averages. In the daily time frame, there is resistance at 33.90 from the trend line and resistance at 34.97 from the horizontal line. There is also a resistance at 41.15 from the horizontal line.
When analyzing the setup rating, Rivian Automotive has a poor technical rating. Also, the setup’s quality is only medium. Lately, its prices have been consolidating while the volatility has been reduced.
Check out the charts below for a better understanding:
Technical Analysis
On average, Rivian Automotive, Inc has a 15774800 daily traded shares volume. This volume is a good indication since it is always great to have a liquid stock. As an average automobile industry performer, RIVN outperforms approximately 63% of 33 stocks in a similar industry.
On Wednesday (November 23, 2022), RIVN displayed a rise of 22.3% at 29.71 from the previous day’s closing price. Based on the last day’s stock price of 28.94, it keeps floating between the 28.95 and 30.18 range during the day.
Taking a look at the RIVN’s 52-week price range, the stock hit a high of 126.75 and a low of 19.25. For the past 30 days, RIVN stock has been subtracting its value at -13.86%.
With the current $28.92 billion market valuation, Rivian has declared to release its quarterly results on November 9, 2022. Here, analysts have estimated a -$1.81 earnings per share. They also expected the annual EPS to grow to -$6.9 and -$5.67 next year. With these estimates, analysts hope for a 53.30% EPS growth for 2022 and a 17.80% growth for 2023.
In the last 9 days, some analysts adjusted their opinions regarding RIVN’s EPS with no downward and upward revisions as it indicates a clearer idea about the short-term price movement of the company.
In contrast, some analysts reviewed the company stock’s current outlook. From there, short-term indicators have assigned the stock an average of 100% sell. As with the medium-term indicators, the stock was categorized at an average of 50% sell, while the long-term indicators suggested an average of 100% sell.
RIVN stock’s PEG ratio is currently in the 0 position. This further shows RIVN’s current price level is -10.87% off its SMA50 and -8.49% away from its SMA20. The stock’s relative strength for a 14-day period oscillates at 43.22. As with the volatility, it stayed at 5.84% over the past week, changing to 6.75% over the past month.
When it comes to the average true range (ATR), the stock is currently at the 2.23 position. Over the next 12 months, the price targets will be as high as 70.00 and as low as 23.00, with an average price target of 47.53.
The current price level of Rivian Automobile, Inc is 22.58% above the forecasted low price target. It is also -135.61% below the forecasted high. Even if the company’s share succeeded in reaching the 50.00 median price, the -68.29% outlook could result in the excitement of the investors.
The outstanding share percentage held by the institutional holders is 69.20%, while it is 0.10% for the insiders. These figures show that as of October 13, 2022, the short shares of the stock were 49.34 million, implying a 2.46 short ratio. This shows a 5.39% of short interest in Rivian’s outstanding shares.
Analysis Conclusion
Rivian Automobile, Inc has recently released its third-quarter vehicle delivery updates. The company produced 7.3k vehicles in Illinois. The company also noted that it is on its way to hitting the 25k annual production target. RIVN stock went up after the news.
FAQs
What is the Rivian market cap?
As of September 29, 2022, the market capitalization of Rivian Automobile, Inc is over $32.14 billion.
What is Rivian stock’s growth rate?
In 2025, Rivian is expected to produce approximately 3 lakh vehicles. If the plan is successful, the company is expected to generate more than $25 billion in revenue.
Why is Rivian stock price low?
Currently, Rivian experiences supply-chain issues that hinder delivery and mass production.
What are Rivian’s plans?
Rivian Automobile plans to build a public charging stations network across the US by 2023. This project could serve as a revolutionary step for the firm.
Fintech-Insight is dedicated to delivering unbiased and dependable insights into cryptocurrency, finance, trading, and stocks. However, we must clarify that we don't offer financial advice, and we strongly recommend users to perform their own research and due diligence.